Cohort exploratory analysis
Background
As a general rule for statistical testing, it is preferable to formulate one or several hypotheses and to test these in a targeted way. Performing numerous tests without any specific plan comes with an increased danger of false-positive results (although it may be appropriate to generate hypotheses if a validation cohort is available).
Types of statistical tests
GPSEA offers four statistical tests:
Fisher Exact Test (FET): Association between two categorical variables. In this case, the first categorical variable is presence/absense of a genotype and the second is presence/absense of annotation to an HPO term.
Mann Whitney U test: Association between presence/absence of a genotype with a phenotype score (e.g., De Vries Score).
t test: Association between presence/absence of a genotype with a numerical test result (e.g., potassium level).
log rank test: Association between presence/absence of a genotype with age-of-onset of a disease or of an HPO feature or with mortality.
Please consult the documentation pages for each of these tests if you are unsure which to use.
Power
Two things must be true to identify a valid genotype-phenotype correlation. First, and obviously, the correlation must actually exist in the dataset being analyzed. Second, there must be statistical power to identify the effect. Power is a measure of the ability of an experimental design and hypothesis testing setup to detect a particular effect if it is truly present (Wikipedia).
It will generally not be possible to perform a formal power calculation because the effect size of most genotype-phenotype correlations is not well known. But, for instance it would not make much sense to test for correlation with a specific variant that occurs in only one of 50 individuals in a cohort.
Exploration
The purpose of the exploratory analysis is thus to decide which tests to perform. GPSEA provides tables and graphics that visualize some of the salient aspects of the cohort and the distribution of the identified variants. We exemplify the exploratory analysis on a cohort of 156 individuals with mutations in TBX5 from Phenopacket Store 0.1.20. The cohort was preprocessed as described in the Input data section and stored at docs/cohort-data/TBX5.0.1.20.json in JSON format.
We start by loading the cohort from the JSON file:
>>> import json
>>> from gpsea.io import GpseaJSONDecoder
>>> fpath_cohort = 'docs/cohort-data/TBX5.0.1.20.json'
>>> with open(fpath_cohort) as fh:
...     cohort = json.load(fh, cls=GpseaJSONDecoder)
>>> len(cohort)
156
Then we choose the transcript and protein identifiers, and we fetch the corresponding data: (see Choose the transcript and protein of interest for more info):
>>> from gpsea.preprocessing import configure_default_tx_coordinate_service, configure_default_protein_metadata_service
>>> tx_id = "NM_181486.4"
>>> px_id = "NP_852259.1"
>>> tx_service = configure_default_tx_coordinate_service(genome_build="GRCh38.p13")
>>> tx_coordinates = tx_service.fetch(tx_id)
>>> pm_service = configure_default_protein_metadata_service()
>>> protein_meta = pm_service.annotate(px_id)
Last, we load HPO v2024-07-01 to use in the exploratory analysis:
>>> import hpotk
>>> store = hpotk.configure_ontology_store()
>>> hpo = store.load_minimal_hpo(release='v2024-07-01')
Interactive exploration
The code for generating reports with tables and figures is located in gpsea.view module.
As a rule of thumb, the reports leverage IPython’s “magic”
to integrate with the environments such as Jupyter notebook.
Returning the report object as the last cell expression will render the report in the cell output.
Cohort summary
We recommend that users start be generating a cohort summary with an overview about the HPO terms, variants, diseases, and variant effects that occur most frequently. We create the viewer and we generate the report for a cohort and transcript. The implicit return of the report at the end of the cell renders the report in the cell output:
>>> from gpsea.view import CohortViewer
>>> viewer = CohortViewer(hpo)
>>> report = viewer.process(cohort=cohort, transcript_id=tx_id)
>>> report
GPSEA cohort analysis
Successfully loaded 156 individuals. 46 were recorded as male, 56 as female, and 54 as unknown sex. No information about individuals' vital status was reported. 52 individuals had disease onset information and 0 had information about the age of last encounter.
No errors encountered.
HPO terms
| n | HPO Term |
|---|---|
| 50 | Atrial septal defect |
| 41 | Ventricular septal defect |
| 40 | Hypoplasia of the radius |
| 36 | Triphalangeal thumb |
| 32 | Absent thumb |
| 32 | Short thumb |
| 30 | Abnormal carpal morphology |
| 27 | Secundum atrial septal defect |
| 15 | Absent radius |
| 14 | Cardiac conduction abnormality |
Measurements
No data regarding measurement assays were provided.Diseases
The cohort members were diagnosed with 1 disease.| n | Disease |
|---|---|
| 156 | Holt-Oram syndrome |
Variants
A total of 53 unique variants were identified in the cohort. Variants were annotated with respect to NM_181486.4.
| n | Variant key | HGVS | Variant Class |
|---|---|---|---|
| 22 | 12_114385521_114385521_C_T | c.710G>A (p.Arg237Gln) | MISSENSE_VARIANT |
| 20 | 12_114401830_114401830_C_T | c.238G>A (p.Gly80Arg) | MISSENSE_VARIANT |
| 8 | 12_114385563_114385563_G_A | c.668C>T (p.Thr223Met) | MISSENSE_VARIANT |
| 6 | 12_114398675_114398675_G_T | c.408C>A (p.Tyr136Ter) | STOP_GAINED |
| 5 | 12_114398682_114398682_C_CG | c.400dup (p.Arg134ProfsTer49) | FRAMESHIFT_VARIANT |
| 5 | 12_114399514_114399514_A_C | c.361T>G (p.Trp121Gly) | MISSENSE_VARIANT, SPLICE_REGION_VARIANT |
| 5 | 12_114403792_114403792_C_CG | c.106_107insC (p.Ser36ThrfsTer25) | FRAMESHIFT_VARIANT |
| 4 | 12_114385522_114385522_G_A | c.709C>T (p.Arg237Trp) | MISSENSE_VARIANT |
| 4 | 12_114398656_114398656_C_CG | c.426dup (p.Ala143ArgfsTer40) | FRAMESHIFT_VARIANT |
| 4 | 12_114403798_114403798_G_GC | c.100dup (p.Ala34GlyfsTer27) | FRAMESHIFT_VARIANT |
Variant effects
The effects were predicted for NM_181486.4
| Variant effect | Count |
|---|---|
| MISSENSE_VARIANT | 85 (50%) |
| FRAMESHIFT_VARIANT | 38 (22%) |
| STOP_GAINED | 19 (11%) |
| SPLICE_REGION_VARIANT | 10 (6%) |
| SPLICE_DONOR_VARIANT | 7 (4%) |
| INFRAME_INSERTION | 2 (1%) |
| STOP_RETAINED_VARIANT | 2 (1%) |
| SPLICE_ACCEPTOR_VARIANT | 2 (1%) |
| SPLICE_DONOR_5TH_BASE_VARIANT | 2 (1%) |
| INTRON_VARIANT | 2 (1%) |
| INFRAME_DELETION | 1 (1%) |
Distribution of variants across protein domains
GPSEA gathers information about protein domains from the UniProt API, and alternatively allows users to enter domain information manually (See Fetch protein data). Protein domains are distinct functional or structural units in a protein. For instance, the following graphic shows domains of the PLD1 protein. The HKD domains contribute to the catalytic activity of the protein whereas the PX and PH domains regulation PLD1 localization within the cell. Observations such as this may suggest testable hypotheses.

Human PLD1 with PX, PH, and two HKD domains.
Users can create a table to display the protein domains and the variants located in them in order to decide whether it might be sensible to test for correlation between variants located in one or more protein domains and a certain phenotype.
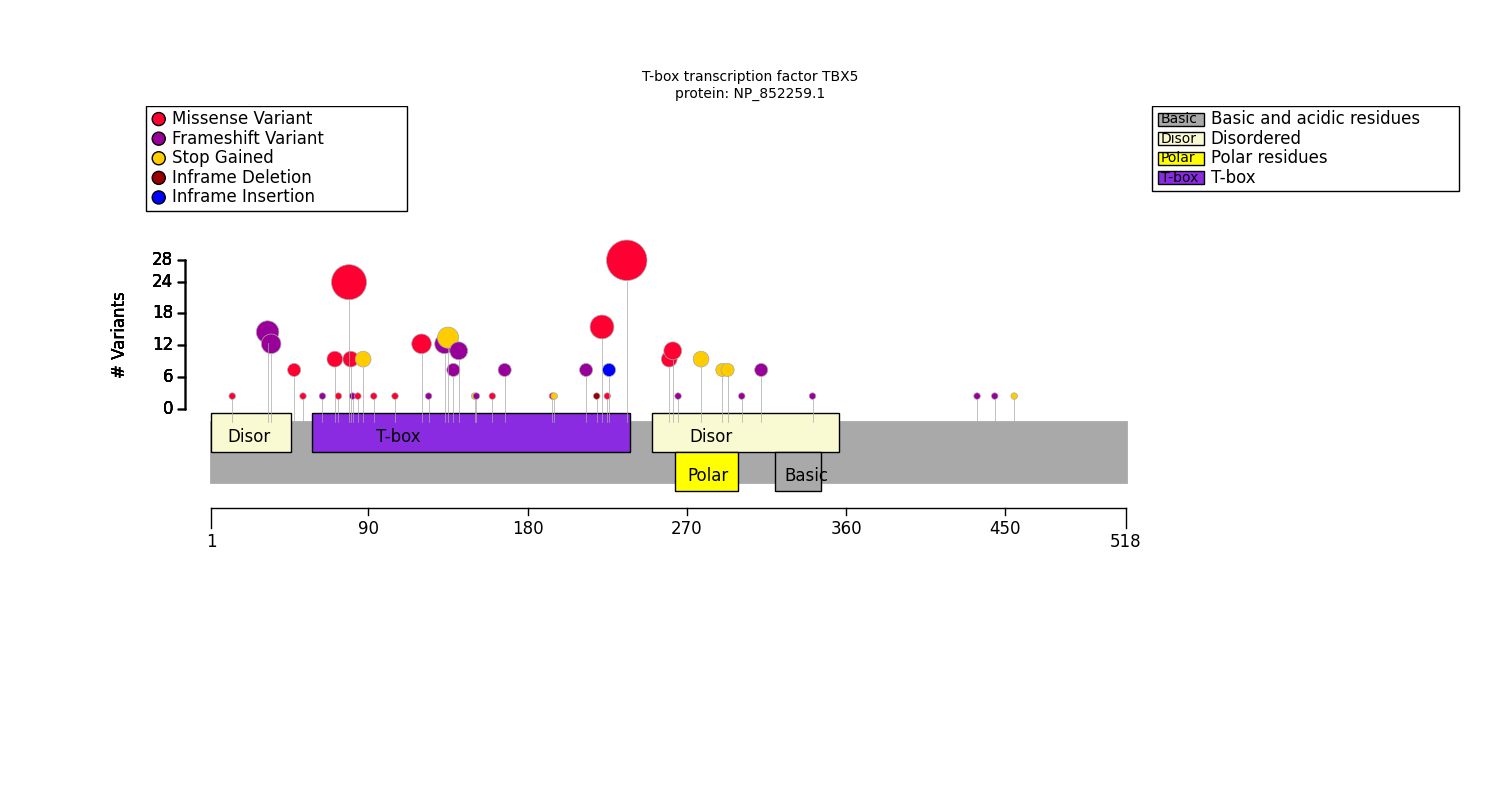
This code will produce the following table on the basis of a cohort of individuals with variants in the TBX5 gene:
>>> from gpsea.view import ProteinVariantViewer
>>> cpd_viewer = ProteinVariantViewer(protein_metadata=protein_meta, tx_id=tx_id)
>>> report = cpd_viewer.process(cohort)
>>> report
T-box transcription factor TBX5: NP_852259.1
T-box transcription factor TBX5 has 5 annotated protein featureses. 139 were found to be located within these features, and 6 were located elsewhere. The total length of the protein is 518 amino acid residues.
| Count | Name | Type | Coordinates | Variants |
|---|---|---|---|---|
| 13 | Disordered | Region | 2 - 46 | p.Ala34GlyfsTer27; p.Ala34ProfsTer32; p.Ser36ThrfsTer25; p.Pro14Thr |
| 107 | T-box | DNA binding | 59 - 238 | p.Pro139GlnfsTer11; p.Ile106Val; p.Phe168LeufsTer6; p.Ser196Ter; p.Arg237Trp; p.Arg237Pro; p.Gly195Ala; p.Ala143ArgfsTer40; p.Thr161Pro; p.Leu65GlnfsTer10; p.Met83PhefsTer6; p.Leu94Arg; p.His220del; p.Tyr136Ter; p.Gln151Ter; p.Ile227_Glu228insTer; p.Arg237Gln; p.Arg81Trp; p.Trp121Gly; p.Thr72Lys; p.Lys226Asn; p.Met74Ile; p.Gly125AlafsTer25; p.Gly80Arg; p.Arg134ProfsTer49; p.Pro85Thr; p.Val214GlyfsTer12; p.Lys88Ter; p.Val153SerfsTer21; p.Thr223Met |
| 19 | Disordered | Region | 251 - 356 | p.Tyr291Ter; p.Gln302ArgfsTer92; p.Val267TrpfsTer127; p.Val263Met; p.Gln315ArgfsTer79; p.Ser261Cys; p.Glu294Ter; p.Arg279Ter; p.Tyr342ThrfsTer52 |
| 8 | Polar residues | Compositional bias | 264 - 299 | p.Arg279Ter; p.Tyr291Ter; p.Glu294Ter; p.Val267TrpfsTer127 |
| 1 | Basic and acidic residues | Compositional bias | 321 - 346 | p.Tyr342ThrfsTer52 |
Plot distribution of variants with respect to the protein sequence
Cohort artist
The simplest way to plot the variant distribution is to use the CohortArtist API:
>>> import matplotlib.pyplot as plt
>>> from gpsea.view import configure_default_cohort_artist
>>> cohort_artist = configure_default_cohort_artist()
>>> fig, ax = plt.subplots(figsize=(15, 8))
>>> cohort_artist.draw_protein(
...     cohort=cohort,
...     protein_id=px_id,
...     ax=ax,
... )

The configure_default_cohort_artist() function gets the default artist
which we use to plot the diagram with the variant distribution across the protein sequence
on Matplotlib axes.
Protein visualizer
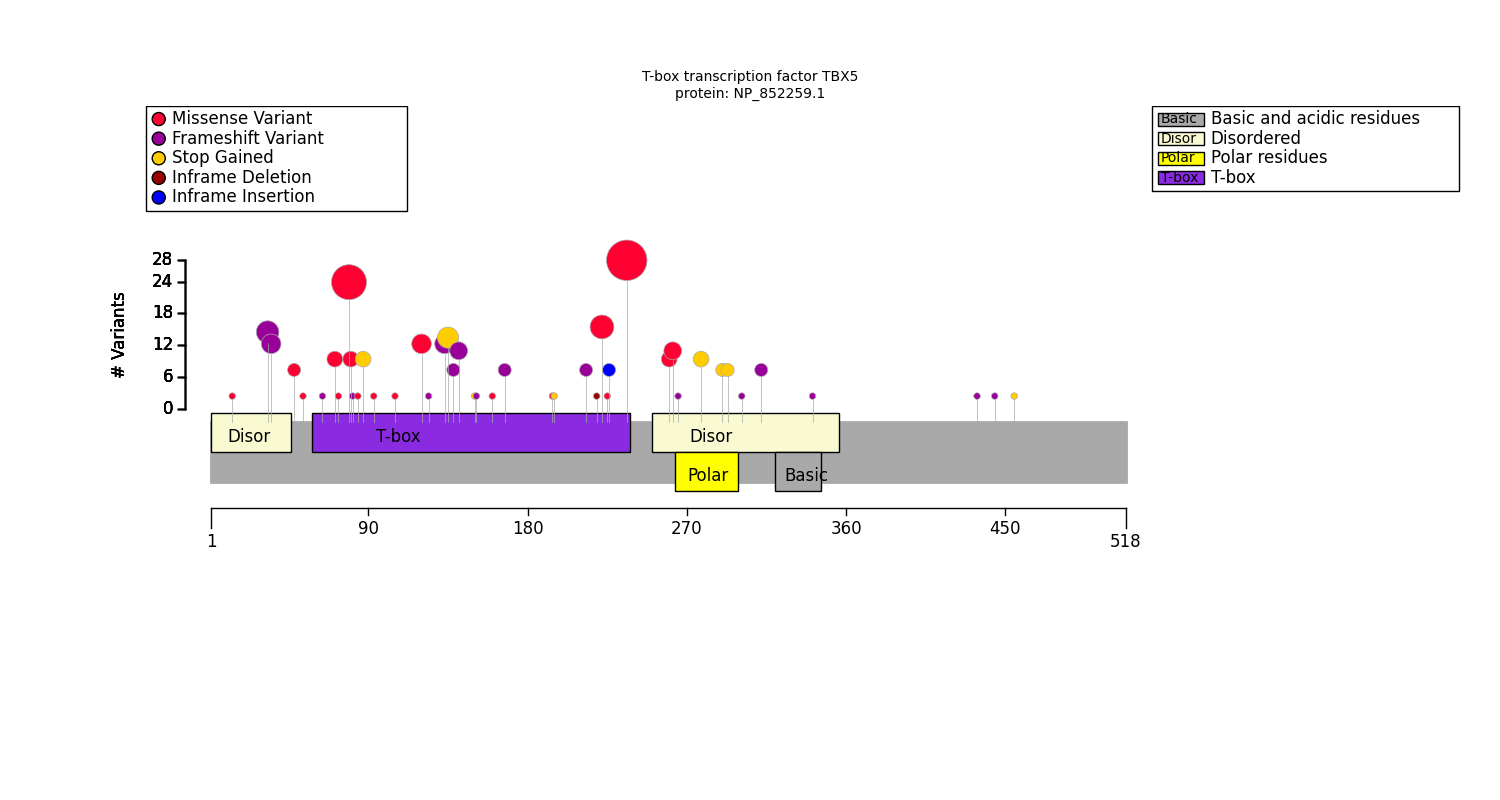
Sometimes, however, things do not work out-of-the-box, e.g. because protein metadata is not available from Uniprot (the default), and we may need to use the lower-level components.
The ProteinVisualizer takes cohort and the protein metadata
to plot the distribution of variants on a protein diagram:
>>> from gpsea.view import ProteinVisualizer
>>> fig, ax = plt.subplots(figsize=(15, 8))
>>> visualizer = ProteinVisualizer()
>>> visualizer.draw_protein(
...     cohort=cohort,
...     protein_metadata=protein_meta,
...     ax=ax,
... )
