Generate a 2D or 2D layout of a graph using the UMAP algorithm. See here for details: igraph_layout_umap
layout_umap(graph, use_3d = FALSE, prefix = "UMAP", ...)Arguments
Value
A matrix of x and y coordinates for each node in the graph.
Examples
set.seed(2024)
data(eds_marfan_kg)
g <- eds_marfan_kg |>
fetch_nodes(pcategory == "biolink:Disease", limit = 40) |>
expand(
predicates = "biolink:has_phenotype",
categories = "biolink:PhenotypicFeature"
) |>
tidygraph::sample_n(200) |>
expand(categories = "biolink:Gene")
#> `sample_n()` argument `.env` is deprecated and no longer has any effect.
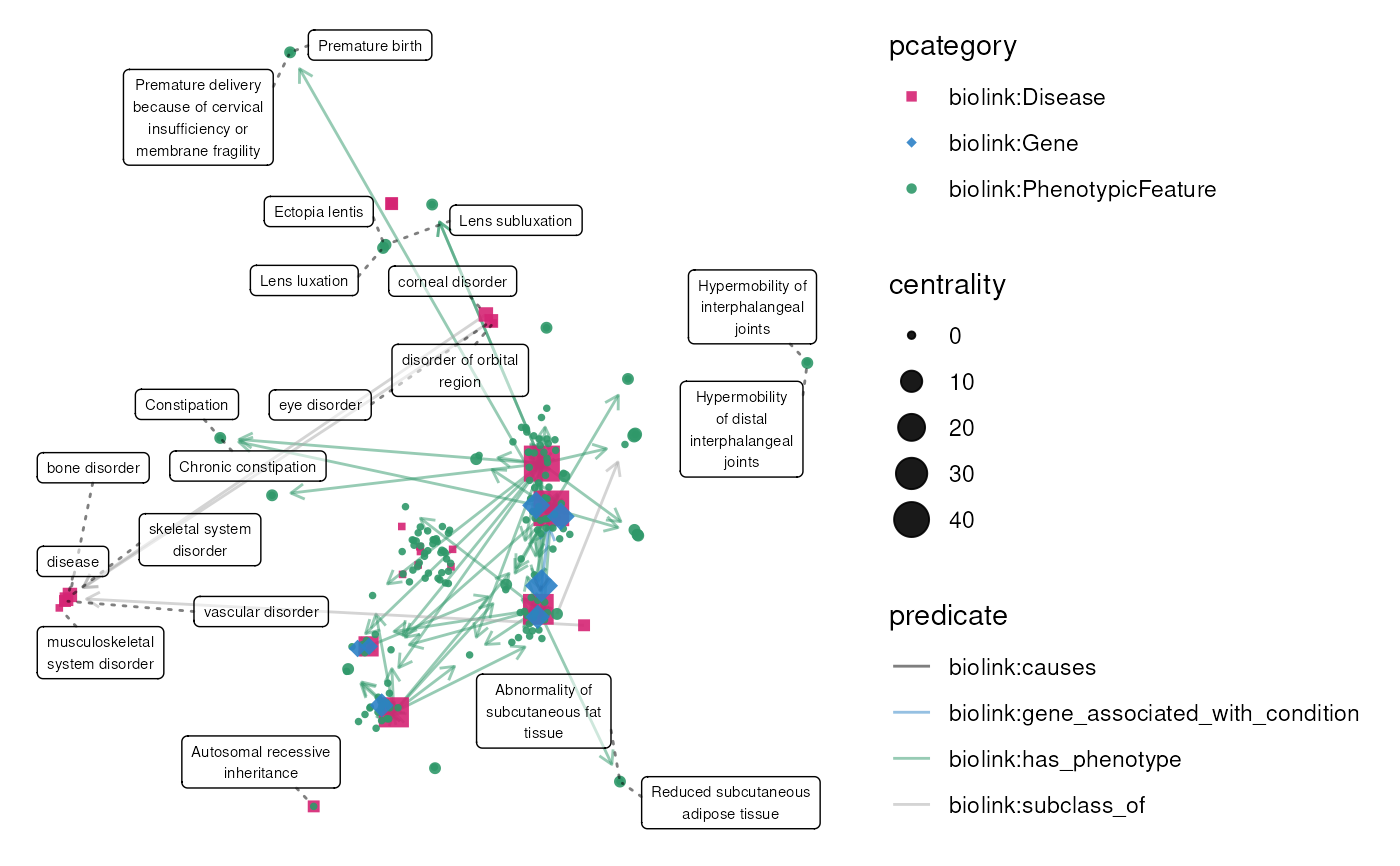
X <- layout_umap(g)
g <- graph_centrality(g)
#> Computing node centrality.
plot(g, layout = X, node_size = centrality)
#> Warning: ggrepel: 196 unlabeled data points (too many overlaps). Consider increasing max.overlaps