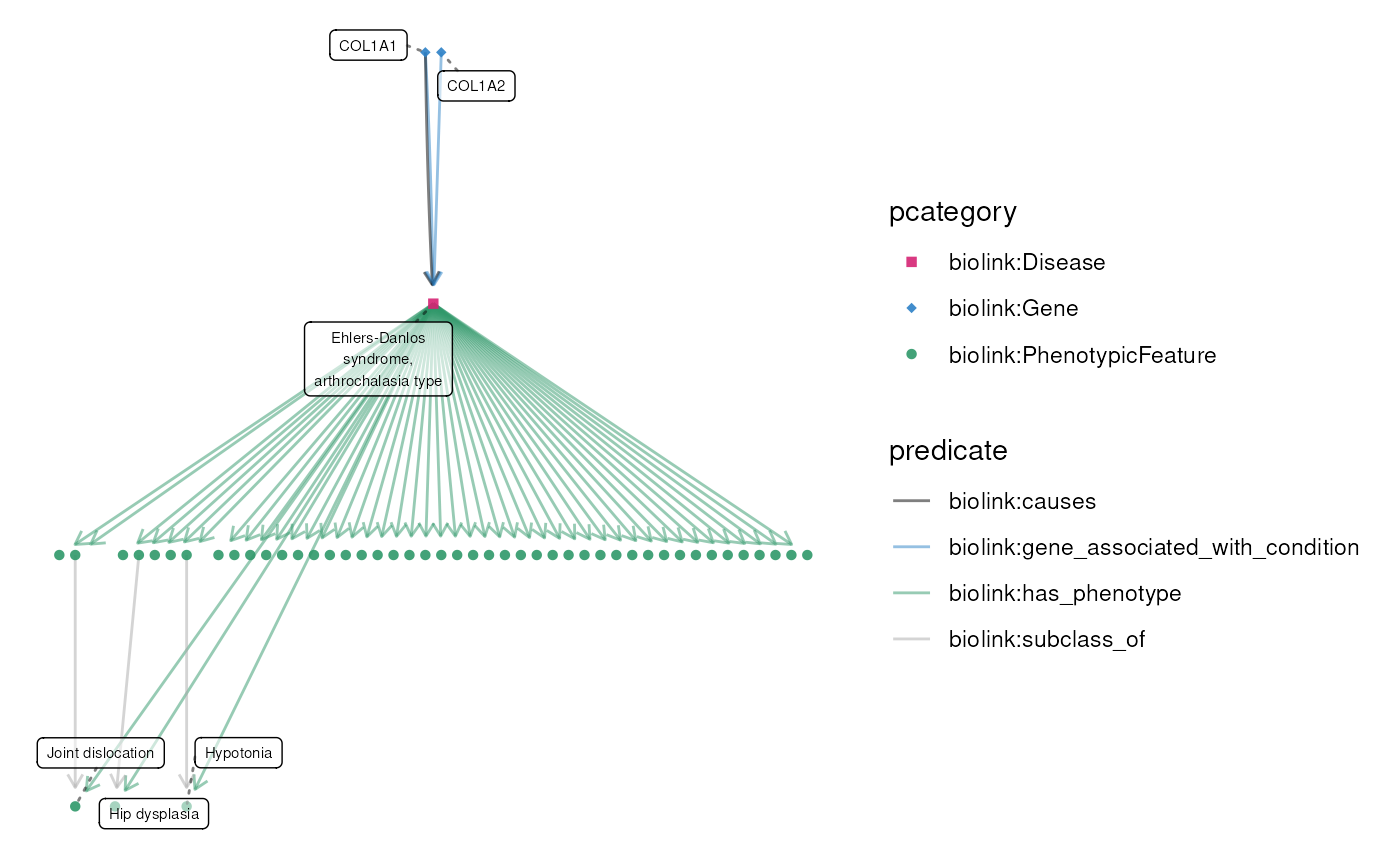
Specialized plot() function for KGX graphs
# S3 method for class 'tbl_kgx'
plot(
  x,
  ...,
  layout = "auto",
  node_color = pcategory,
  node_shape = namespace,
  edge_color = predicate,
  edge_linetype = primary_knowledge_source,
  node_label = name,
  plot_ids = FALSE,
  label_size = 2,
  fan_strength = 2,
  edge_alpha = 0.9,
  node_alpha = 0.9
)
Arguments
- x
A tbl_kgx graph.
- ...
Arguments passed on to
ggraph::ggraphgraphThe object containing the graph. See Details for a list of supported classes. Or a
layout_ggraphobject as returned fromcreate_layoutin which case all subsequent arguments is ignored.
- layout
The layout to use for the plot. Default is "auto" as used by
ggraph.- node_color
The column to use for node color. Default is "pcategory".
- node_shape
The column to use for node shape Default is "namespace".
- edge_color
The column to use for edge color. Default is "predicate".
- edge_linetype
The column to use for edge line type. Default is "primary_knowledge_source".
- node_label
The column to use for node labels. Defaults to "name".
- plot_ids
Whether to show node IDs in node labels. Defaults to FALSE.
- label_size
Size of node label text. Default is 2.
- fan_strength
Fan strength in ggraph's geom_edge_fan, Default is 2.
- edge_alpha
Alpha value for edges, default 0.9.
- node_alpha
Alpha value for nodes, default 0.9.
Value
A ggraph object.
Examples
data(eds_marfan_kg)
g <- eds_marfan_kg |>
    fetch_nodes(query_ids = "MONDO:0007525") |>
    expand(
        predicates = "biolink:has_phenotype",
        categories = "biolink:PhenotypicFeature"
    ) |>
    expand(categories = "biolink:Gene")
plot(g)
#> Using "sugiyama" as default layout
#> Warning: ggrepel: 45 unlabeled data points (too many overlaps). Consider increasing max.overlaps