A ggplot2/ggraph theme inspired by the Monarch Initative.
theme_monarch(
  palettes = monarch_palettes(),
  layer_args = list(theme_bw = list(), theme = list(axis.text = ggplot2::element_blank(),
    axis.ticks = ggplot2::element_blank(), axis.title = ggplot2::element_blank(),
    legend.key = ggplot2::element_blank(), panel.background = ggplot2::element_blank(),
    panel.border = ggplot2::element_blank(), panel.grid = ggplot2::element_blank()),
    scale_edge_color_manual = list(values = palettes$edges$discrete, na.value = "grey"),
    scale_color_manual = list(values = palettes$nodes$discrete, na.value = "grey"),
    scale_shape_manual = list(values = palettes$nodes$shape,
     na.value = 19),
    scale_edge_fill_manual = list(values = palettes$edges$discrete, na.value = "grey",
    guide = "none"))
)
Arguments
Value
ggplot2/ggraph object.
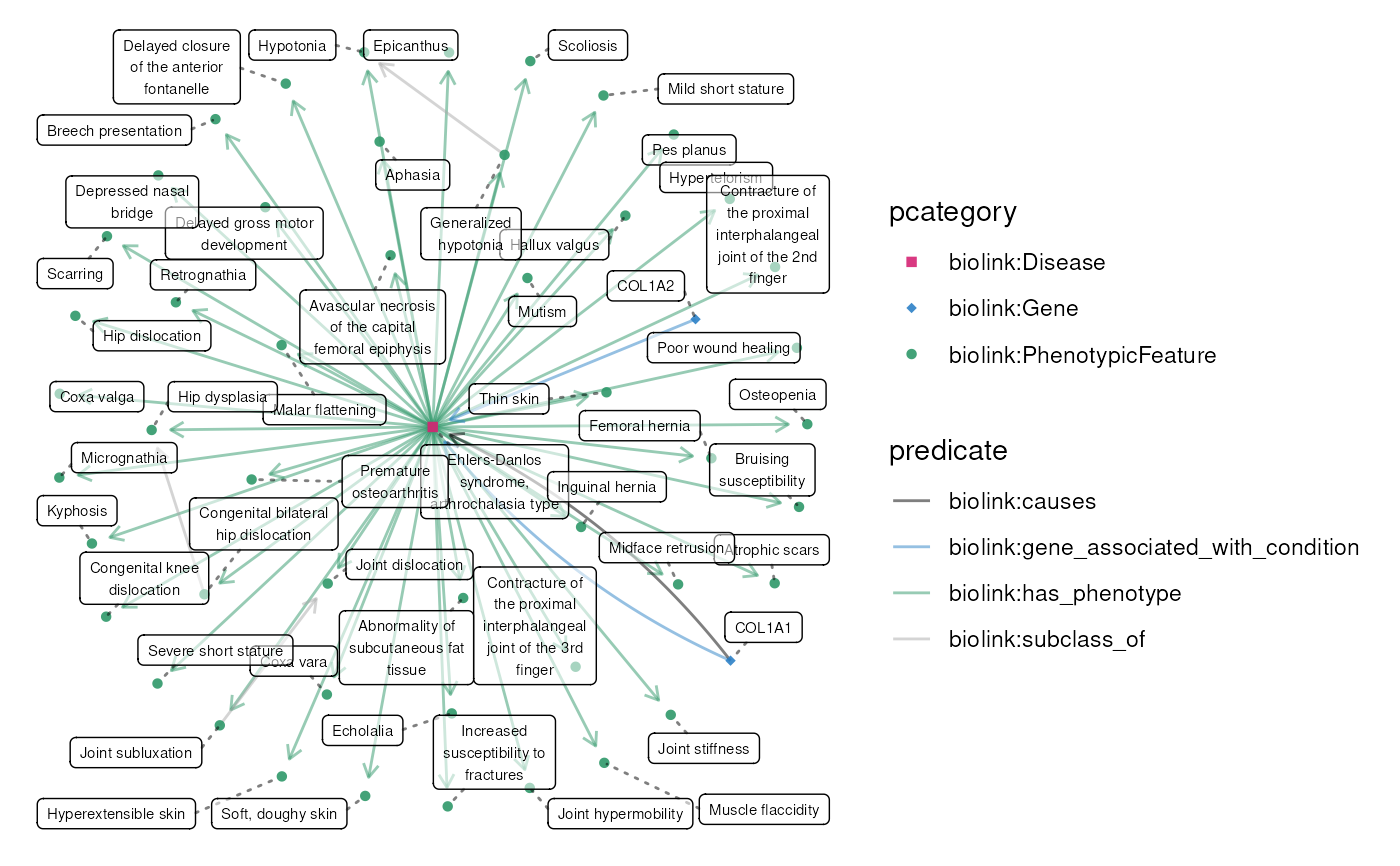
Examples
filename <- system.file("extdata", "eds_marfan_kg.tar.gz", package = "monarchr")
g <- file_engine(filename) |>
          fetch_nodes(query_ids = "MONDO:0007525") |>
          expand(predicates = "biolink:has_phenotype",
                 categories = "biolink:PhenotypicFeature")|>
          expand(categories = "biolink:Gene")
plot(g, layout="kk") + theme_monarch()
#> Scale for edge_colour is already present.
#> Adding another scale for edge_colour, which will replace the existing scale.
#> Scale for edge_fill is already present.
#> Adding another scale for edge_fill, which will replace the existing scale.
#> Scale for colour is already present.
#> Adding another scale for colour, which will replace the existing scale.
#> Scale for shape is already present.
#> Adding another scale for shape, which will replace the existing scale.