Roll node data up (along) or down (against) transitive edges. Use with mutate()
Source: R/rollup.R
rolling.RdThis function computes, for each node, an aggregated set of data from all
descendant (for roll-ups) or ancestor (for roll-downs) nodes defined by
specified edge predicates. Designed for use with mutate()
on node data, for each node N, the specified fun is called
on the node table column filtered to nodes that can reach (be reached by)
N over
predicates edges. If include_self is true, N itself is included.
roll_up(
  column = NULL,
  fun = c,
  include_self = TRUE,
  predicates = "biolink:subclass_of",
  ...
)

roll_down(
  column = NULL,
  fun = c,
  include_self = TRUE,
  predicates = "biolink:subclass_of",
  ...
)
Arguments
- column
The node column to draw rollup or rolldown information from.
- fun
The aggregation function to use when rolling up or down. Default is
c- include_self
Whether to include each nodes' value in
columnin the rollup/rolldown for that node.- predicates
A vector of relationship predicates (nodes in g are subjects in the KG), indicating which edges to consider in the rollup/rolldown. Should be transitive; default
biolink:subclass_of- ...
Other parameters (unused)
Value
Vector or list, with one entry per node.
Details
Note that path counts and order are not considered; rollups (rolldowns) collect information from all descendant (ancestor) nodes as a set.
The return value will be either a list, or if the result would be a list with all length-1 or length-0 elements, a vector with 0-length elements replaced by NA. Practically, this results in a list when necessary and a vector otherwise.
See also
roll_down(), descendants(), [ancestors(), transfer(),
transitive_closure()]
Examples
library(dplyr)
library(tidygraph)
data(eds_marfan_kg)
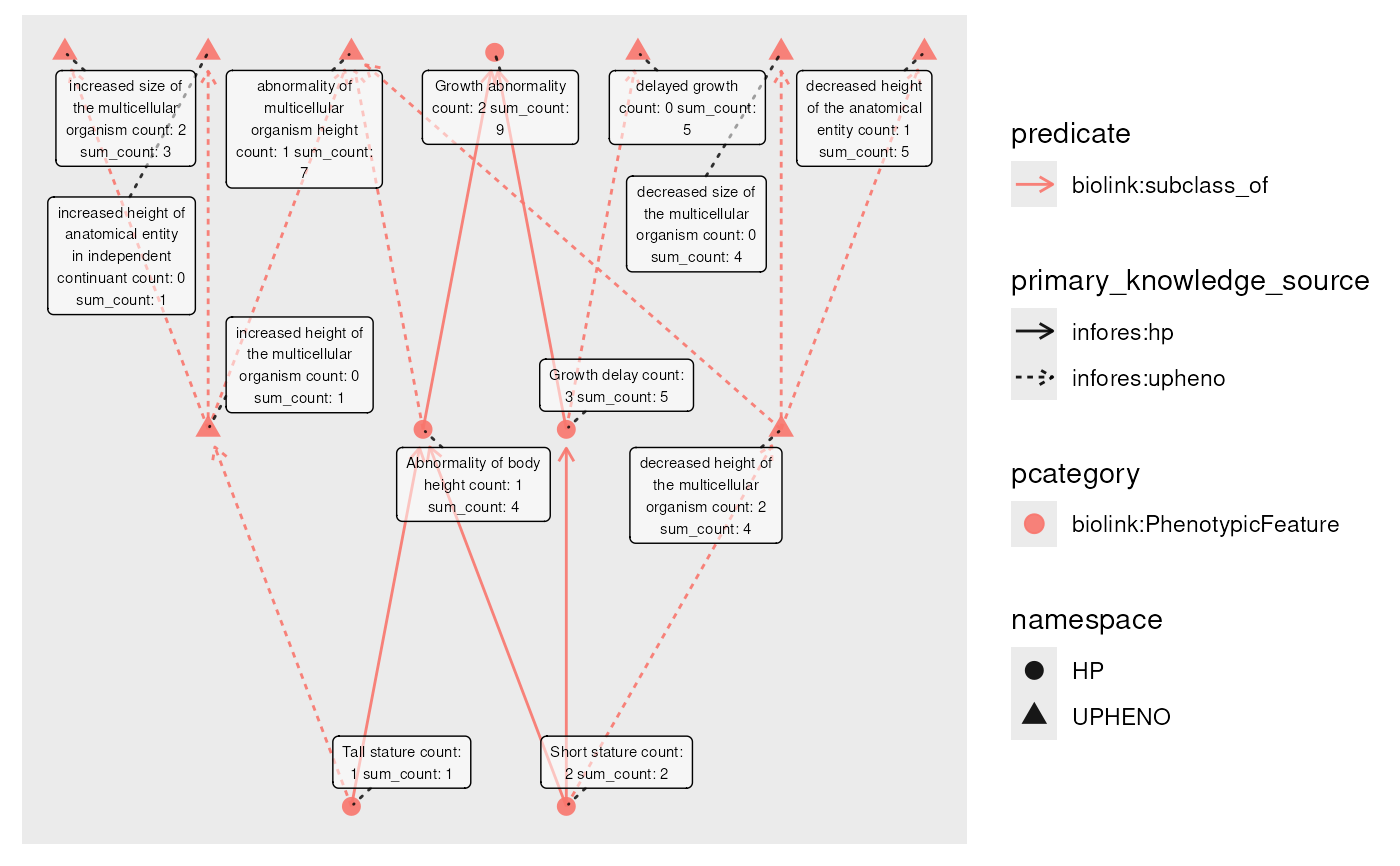
eds_marfan_kg |>
fetch_nodes(name == "Tall stature" | name == "Short stature") |>
# get 2 levels of ancestors
expand_n(predicates = "biolink:subclass_of", direction = "out", n = 2) |>
activate(nodes) |>
# random count value per node
mutate(count = rpois(graph_order(), 1.5)) |>
# apply sum to descendant (and self) values
mutate(sum_count = roll_up(count, fun = sum, include_self = TRUE)) |>
plot(node_label = paste(name, " count: ", count, "sum_count: ", sum_count))
#> Initial graph size:2nodes ||0edges
#> Expanding graph: iteration 1/2
#> Graph size:6nodes ||5edges
#> Expanding graph: iteration 2/2
#> Graph size:13nodes ||15edges
#> Using "sugiyama" as default layout