Survival analysis
Example analysis
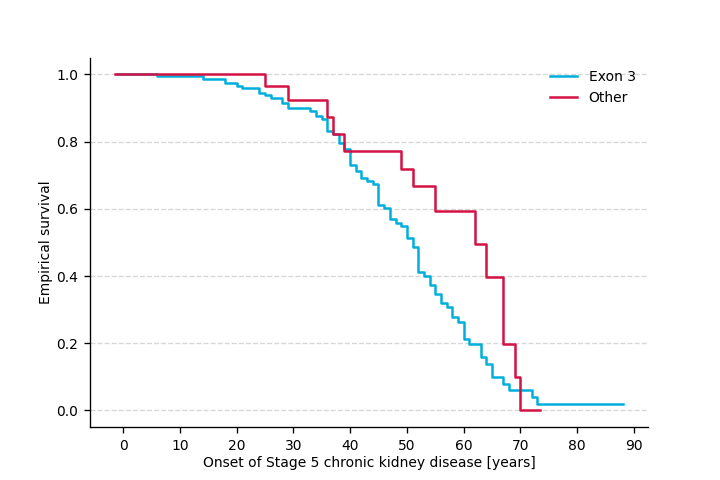
We will analyze the time until end stage renal disease in 207 individuals with mutations in UMOD. Specifically, we will test for difference between the onset of the end stage renal disease in the individuals with mutation in exon 3 of UMOD vs. individuals with other UMOD mutation.
Load cohort
For the purpose of this analysis, we will load the Cohort
from a JSON file.
The cohort was prepared from phenopackets as described in Create a cohort section,
and then serialized as a JSON file following the instructions in Persist the cohort for later section.
>>> import json
>>> from gpsea.io import GpseaJSONDecoder
>>> fpath_cohort_json = 'docs/cohort-data/UMOD.0.1.20.json'
>>> with open(fpath_cohort_json) as fh:
...     cohort = json.load(fh, cls=GpseaJSONDecoder)
>>> len(cohort)
207
Configure analysis
MANE transcript of UMOD.
>>> tx_id = 'NM_003361.4'
Genotype classifier
One allele of exon 3 vs. one allele of elsewhere.
>>> from gpsea.analysis.predicate import exon
>>> is_in_exon3 = exon(exon=3, tx_id=tx_id)
>>> is_in_exon3.description
'overlaps with exon 3 of NM_003361.4'
Monoallelic classifier to compare one allele of UMOD exon 3 variant versus one allele of other UMOD variant:
>>> from gpsea.analysis.clf import monoallelic_classifier
>>> gt_clf = monoallelic_classifier(
...     a_predicate=is_in_exon3,
...     b_predicate=~is_in_exon3,
...     a_label="Exon 3", b_label="Other",
... )
>>> gt_clf.class_labels
('Exon 3', 'Other')
Survival endpoint
The endpoint of our study is defined as development of end stage renal disease. In the UMOD cohort, this is encoded with Stage 5 chronic kidney disease (HP:0003774) HPO term. We need to leverage the HPO hierarchy when computing the onset of an HPO term. Let’s load HPO:
>>> import hpotk
>>> store = hpotk.configure_ontology_store()
>>> hpo = store.load_minimal_hpo(release='v2024-07-01')
and now we can create an Endpoint
to compute the time until an individual develops end stage renal disease:
>>> from gpsea.analysis.temporal.endpoint import hpo_onset
>>> term_id = "HP:0003774"  # Stage 5 chronic kidney disease
>>> endpoint = hpo_onset(hpo=hpo, term_id=term_id)
>>> endpoint.description
'Compute time until onset of Stage 5 chronic kidney disease'
Statistical test
We will use Log rank test to compare the age until the endpoint between the genotype groups:
>>> from gpsea.analysis.temporal.stats import LogRankTest
>>> survival_statistic = LogRankTest()
Final analysis
We will put the final analysis together into a SurvivalAnalysis.
>>> from gpsea.analysis.temporal import SurvivalAnalysis
>>> survival_analysis = SurvivalAnalysis(
...     statistic=survival_statistic,
... )
Analysis
We execute the analysis by running
>>> result = survival_analysis.compare_genotype_vs_survival(
...     cohort=cohort,
...     gt_clf=gt_clf,
...     endpoint=endpoint,
... )
>>> result.pval
0.062004258300...
Kaplan-Meier curves
We can plot Kaplan-Meier curves:
>>> from gpsea.model import Age
>>> import matplotlib as mpl
>>> import matplotlib.pyplot as plt
>>> fig, ax = plt.subplots(figsize=(6, 4), dpi=120)
>>> result.plot_kaplan_meier_curves(
...     ax=ax,
... )
>>> _ = ax.xaxis.set(
...     # Show X axis in years ...
...     major_formatter=mpl.ticker.FuncFormatter(lambda x, pos: f"{x / Age.DAYS_IN_YEAR:.0f}"),
...     # ... with a tick for every decade
...     major_locator=mpl.ticker.MultipleLocator(10 * Age.DAYS_IN_YEAR),
... )
>>> _ = ax.set(
...     xlabel=endpoint.name + " [years]",
...     ylabel="Event-free proportion",
... )
>>> _ = ax.grid(axis="y")
Raw data
The result includes the survival values for all cohort members:
>>> survivals = result.data.sort_index()
>>> survivals.head()
                          genotype    phenotype
patient_id
AII.1[PMID_22034507_AII_1]       0    Survival(value=18262.5, is_censored=True)
AII.2[PMID_22034507_AII_2]       0    None
AII.3[PMID_22034507_AII_3]       0    Survival(value=16436.25, is_censored=True)
AII.5[PMID_22034507_AII_5]       0    Survival(value=22280.25, is_censored=False)
AIII.4[PMID_22034507_AIII_4]     0    Survival(value=19723.5, is_censored=False)
Each line corresponeds to an individual and the dataframe is indexed by the individual’s identifier/label.
The genotype column contains the genotype class code,
and phenotype column includes a Survival value
or None if computing the survival was impossible (see hpo_onset() for details).
The Survival reports the number of days until attaining the endpoint,
here defined as end stage renal disease (is_censored=False),
or until the individual dropped out of the analysis (is_censored=True).
Troubleshooting
Sometimes the survival analysis fails and an AnalysisException is raised.
For instance, the current Logrank test implementation reports a p value of NaN
if the survival is the same for all individuals.
This is unlikely an expected outcome, therefore GPSEA raises
an AnalysisException to force the user to troubleshoot.
To help with troubleshooting, the data computed prior detecting the error is included in the exception’s
data attribute. In survival analysis, the data should include
the identifiers, genotype classes, and survivals of the tested individuals.
Let’s show this on an example. We will create a toy cohort of 10 individuals with onset of Lynch syndrome I (OMIM:120435) at 40 years.
>>> from gpsea.model import Cohort, Patient, Disease, Age
>>> onset = Age.from_iso8601_period("P40Y")
>>> individuals = [
...     Patient.from_raw_parts(
...         labels=label,
...         diseases=(
...             Disease.from_raw_parts(
...                 term_id="OMIM:120435",
...                 name="Lynch syndrome I",
...                 is_observed=True,
...                 onset=onset,
...             ),
...         ),
...     )
...     for label in "ABCDEFGHIJ"  # 10 individuals
... ]
>>> cohort = Cohort.from_patients(individuals)
We will assign them into genotype classes on random, …
>>> from gpsea.analysis.clf import random_classifier
>>> gt_clf = random_classifier(seed=123)
>>> gt_clf.description
'Classify the individual into random classes'
… using the Lynch syndrome I diagnosis as the endpoint …
>>> from gpsea.analysis.temporal.endpoint import disease_onset
>>> endpoint = disease_onset(disease_id="OMIM:120435")
>>> endpoint.description
'Compute time until OMIM:120435 onset'
… and we will use Logrank test for differences in survival.
>>> from gpsea.analysis.temporal.stats import LogRankTest
>>> survival_statistic = LogRankTest()
We put together the survival analysis …
>>> from gpsea.analysis.temporal import SurvivalAnalysis
>>> survival_analysis = SurvivalAnalysis(
...     statistic=survival_statistic,
... )
… which we expect to fail with an AnalysisException:
>>> result = survival_analysis.compare_genotype_vs_survival(
...     cohort=cohort,
...     gt_clf=gt_clf,
...     endpoint=endpoint,
... )
Traceback (most recent call last):
  ...
gpsea.analysis._base.AnalysisException: The survival values did not meet the expectation of the statistical test!
The genotype classes and survival values can be retrieved from the exception:
>>> from gpsea.analysis import AnalysisException
>>> try:
...     result = survival_analysis.compare_genotype_vs_survival(
...         cohort=cohort,
...         gt_clf=gt_clf,
...         endpoint=endpoint,
...     )
... except AnalysisException as ae:
...     genotypes = ae.data["genotype"]
...     survivals = ae.data["survival"]
and the values can come in handy in troubleshooting:
>>> genotypes[:3]
(0, 0, 0)
>>> survivals[:3]
(Survival(value=14610.0, is_censored=False), Survival(value=14610.0, is_censored=False), Survival(value=14610.0, is_censored=False))